ModDotPlot

![]()
- Cite
- About
- Installation
- Usage
- Questions
- Known Issues
Cite
Alexander P Sweeten, Michael C Schatz, Adam M Phillippy, ModDotPlot—rapid and interactive visualization of tandem repeats, Bioinformatics, Volume 40, Issue 8, August 2024, btae493, https://doi.org/10.1093/bioinformatics/btae493
If you use ModDotPlot for your research, please cite our software!
About
ModDotPlot is a dot plot visualization tool designed to be used at scale, both for smaller sequences and whole genomes. ModDotPlot is the spiritual successor to StainedGlass. The core algorithm breaks an input sequence down into intervals of sketched k-mers called modimizers. This enables the rapid approximation of the Average Nucleotide Identity between combinations of intervals!
If you’re interested in learning more about ModDotPlot and how to visualize tandem repeats, we have an in-depth YouTube video tutorial hosted by the BioDiversity Genomics Academy.
Installation
ModDotPlot can be installed by running pip install moddotplot. It requires Python 3.7+ to run. Alternatively, you can download the current release from GitHub by using:
git clone https://github.com/marbl/ModDotPlot.git
cd ModDotPlot
Although optional, it’s recommended to setup a virtual environment before using ModDotPlot:
python -m venv venv
source venv/bin/activate
Once activated, you can install the required dependencies:
python -m pip install .
Finally, confirm that the installation was installed correctly and that your version is up to date by running moddotplot -h:
  __  __           _   _____        _     _____  _       _
 |  \/  |         | | |  __ \      | |   |  __ \| |     | |
 | \  / | ___   __| | | |  | | ___ | |_  | |__) | | ___ | |_
 | |\/| |/ _ \ / _` | | |  | |/ _ \| __| |  ___/| |/ _ \| __|
 | |  | | (_) | (_| | | |__| | (_) | |_  | |    | | (_) | |_
 |_|  |_|\___/ \__,_| |_____/ \___/ \__| |_|    |_|\___/ \__|

 v0.9.8

usage: moddotplot [-h] {interactive,static} ...

ModDotPlot: Visualization of Tandem Repeats

positional arguments:
  {interactive,static}  Choose mode: interactive or static
    interactive         Interactive mode commands
    static              Static mode commands

options:
  -h, --help            show this help message and exit
Note that running moddotplot -h might take a while at first! This is because the Python interpreter is compiling source code into the pycache directory. Subsequent runs will use the pre-compiled code and load much faster!
Usage
ModDotPlot must be run either in static mode, or interactive mode:
Static Mode
moddotplot static <ARGS>
Running ModDotPlot in static mode quickly create plots under the specified output directory -o. By default, running ModDotPlot in static mode this will produce the following files:
- A paired-end bed file
.bedpe, containing intervals alongside their corresponding identity estimates. - A self-identity dotplot for each sequence, as both an upper triangle matrix
_TRIand full matrix_FULLrepresentation. - A histogram of identity values for each sequence.

All plots and histograms are output in a vectorized (default: .svg) and rasterized .png image. Plotnine is the Python plotting library used, with CairoSVG used for converting between image formats.
ModDotPlot supports highly customizable plotting features in static mode. See static mode commands for a complete list of features.
Interactive Mode
moddotplot interactive <ARGS>
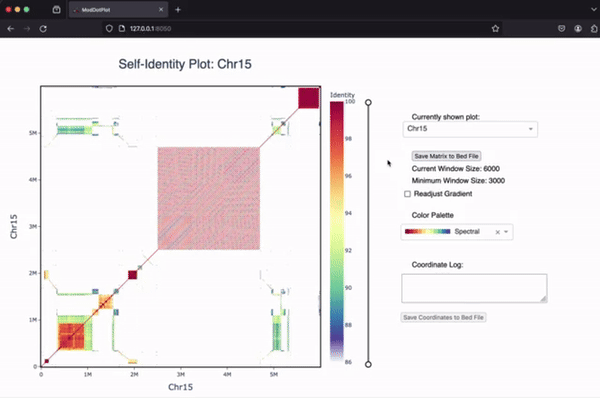
Running ModDotPlot in interactive mode will launch a Dash application on your machine’s localhost. Open any web browser and go to http://127.0.0.1:<PORT_NUMBER> to view the interactive plot (this should happen automatically, but depending on your environment you might need to copy and paste this URL into your web browser). Running Ctrl+C on the command line will exit the Dash application. The default port number used by Dash is 8050, but this can be customized using the --port command (see interactive mode commands for further info, and Sample run - Port Forwarding for tips on running interactive mode on an HPC environment).
Standard arguments
The following arguments are the same in both interactive and static mode:
-f / --fasta <file>
Fasta files to input. Multifasta files are accepted. Interactive mode will only support a maximum of two sequences at a time.
-b / --bed <.bed file>
Input bedfile used for dotplot annotation (note: this is not the same as the paired-end bed file produced by ModDotPlot). If selected, this will produce an annotated bedtrack image _ANNOTATION_TRACK.svg in static mode, and open an IGV js track in the interactive mode Dash application. The name in the bedfile must match the name of the fasta sequence header in order to produce a correct bed track.
-k / --kmer <int>
K-mer size to use. This should be large enough to distinguish unique k-mers with enough specificity, but not too large that sensitivity is removed. Default: 21.
-o / --output-dir <string>
Name of output directory for bed file & plots. Default is current working directory.
-id / --identity <int>
Minimum sequence identity cutoff threshold. Default is 86. While it is possible to go as low as 50% sequence identity, anything below 80% is not recommended.
--delta <float>
Each partition takes into account a fraction of its neighboring partitions k-mers. This is to avoid sub-optimal identity scores when partitons don’t overlap identically. Default is 0.5, and the accepted range is between 0 and 1. Anything greater than 0.5 is not recommended.
-m / --modimizer <int>
Modimizer sketch size. Must be lower than window size w. A lower sketch size means less k-mers to compare (and faster runtime), at the expense of lower accuracy. Recommended to be kept >= 1000.
--forward <bool>
Use forward k-mers only, instead of the default of canonical k-mers. Warning: this will give strand specific output.
-r / --resolution <int>
Dotplot resolution. This corresponds to the number of windows each input sequence is partitioned into. Default is 1000. Overrides the --window parameter.
--compare <bool>
If set when 2 or more sequences are input into ModDotPlot, this will show an A vs. B style plot, in addition to a self-identity plot. Note that interactive mode currently only supports a maximum of two sequences. If more than two sequences are input, only the first two will be shown.
--compare-only <bool>
If set when 2 or more sequences are input into ModDotPlot, this will show an A vs. B style plot, without showing self-identity plots.
--ambiguous <bool>
By default, k-mers that are homopolymers of ambiguous IUPAC codes (eg. NNNNNNNNNNN’s) are excluded from identity estimation. This results in gaps along the central diagonal for these regions. If desired, these can be kept by setting the —-ambiguous flag in both interactive and static mode.
Static Mode Commands
Input/Output & Formatting Commands
-l / --load <.bedpe file>
Create a plot from a previously computed pairwise bed file. Skips Average Nucleotide Identity computation. Used instead of -f/--fasta. Will only accept paired-end bed files produced by ModDotPlot.
-c / --config <.json file>
Run moddotplot static with a config file instead of command line args. Example syntax in config/config.json. Recommended when creating a really customized plot. Used instead of -f/–fasta.
--cooler <bool>
If set, will output a matrix as a cooler file for each input sequence, in addition to a bedpe file.
--no-bedpe <bool>
Skip output of bed file.
--no-hist <bool>
Skip output of histogram legend.
--no-plot <bool>
Save .bedpe to file, but skip rendering of plots.
--width <int>
Adjust width of self dot plots. Default is 9 inches.
--dpi <int>
Image resolution in dots per inch (not to be confused with dotplot resolution). Default is 300.
--vector <str>
Vectorized image format to output to. Must be one of [“svg”, “pdf”, “ps”]. Default: svg
--deraster <bool>
By default, vectorized outputs rasterize the actual dotplot (not the axis). This is done to save space, as a high-resolution dotplot can be extremely space inefficient and prevent use of image manipulation software. This plot rasterization can be removed using this flag.
Plot Customization Commands
-w / --window <int>
Window size. Unlike interactive mode, only one matrix will be created, so this represents the only window size. Default is set to n/1000 (eg. 3000bp for a 3Mbp sequence).
--region <list of strs>
Plot only a particular range for a given sequence. Syntax is UCSC style (chr:start-end).
--palette <str>
List of accepted palettes can be found here. Palettes are segregated into 3 types: Diverging, Qualitative, and Sequential. Syntax is the name of the palette, followed by an underscore and the number of colors, eg. OrRd_8. Default is Spectral_11.
--breakpoints <list of ints>
Add custom identity threshold breakpoints. Note that the number of breakpoints must be equal to the number of colors + 1, otherwise an error will occur.
--palette-orientation <bool>
Flip sequential order of color palette. Set to - by default for divergent palettes.
--color <list of hexcodes>
List of custom colors in hexcode format can be entered sequentially, mapped from low to high identity.
-t / --axes-ticks <list of ints>
Custom tickmarks for x and y axis. Values outside of the --axes-limits will not be shown.
-a / --axes-limits <int>
Change axis limits for x and y axis. Useful when comparing multiple plots, allowing them to stay in scale.
--bin-freq <bool>
By default, histograms are evenly spaced based on the number of colors and the identity threshold. Select this argument to bin based on the frequency of observed identity values.
Sample run - Static Plots
Using a config file
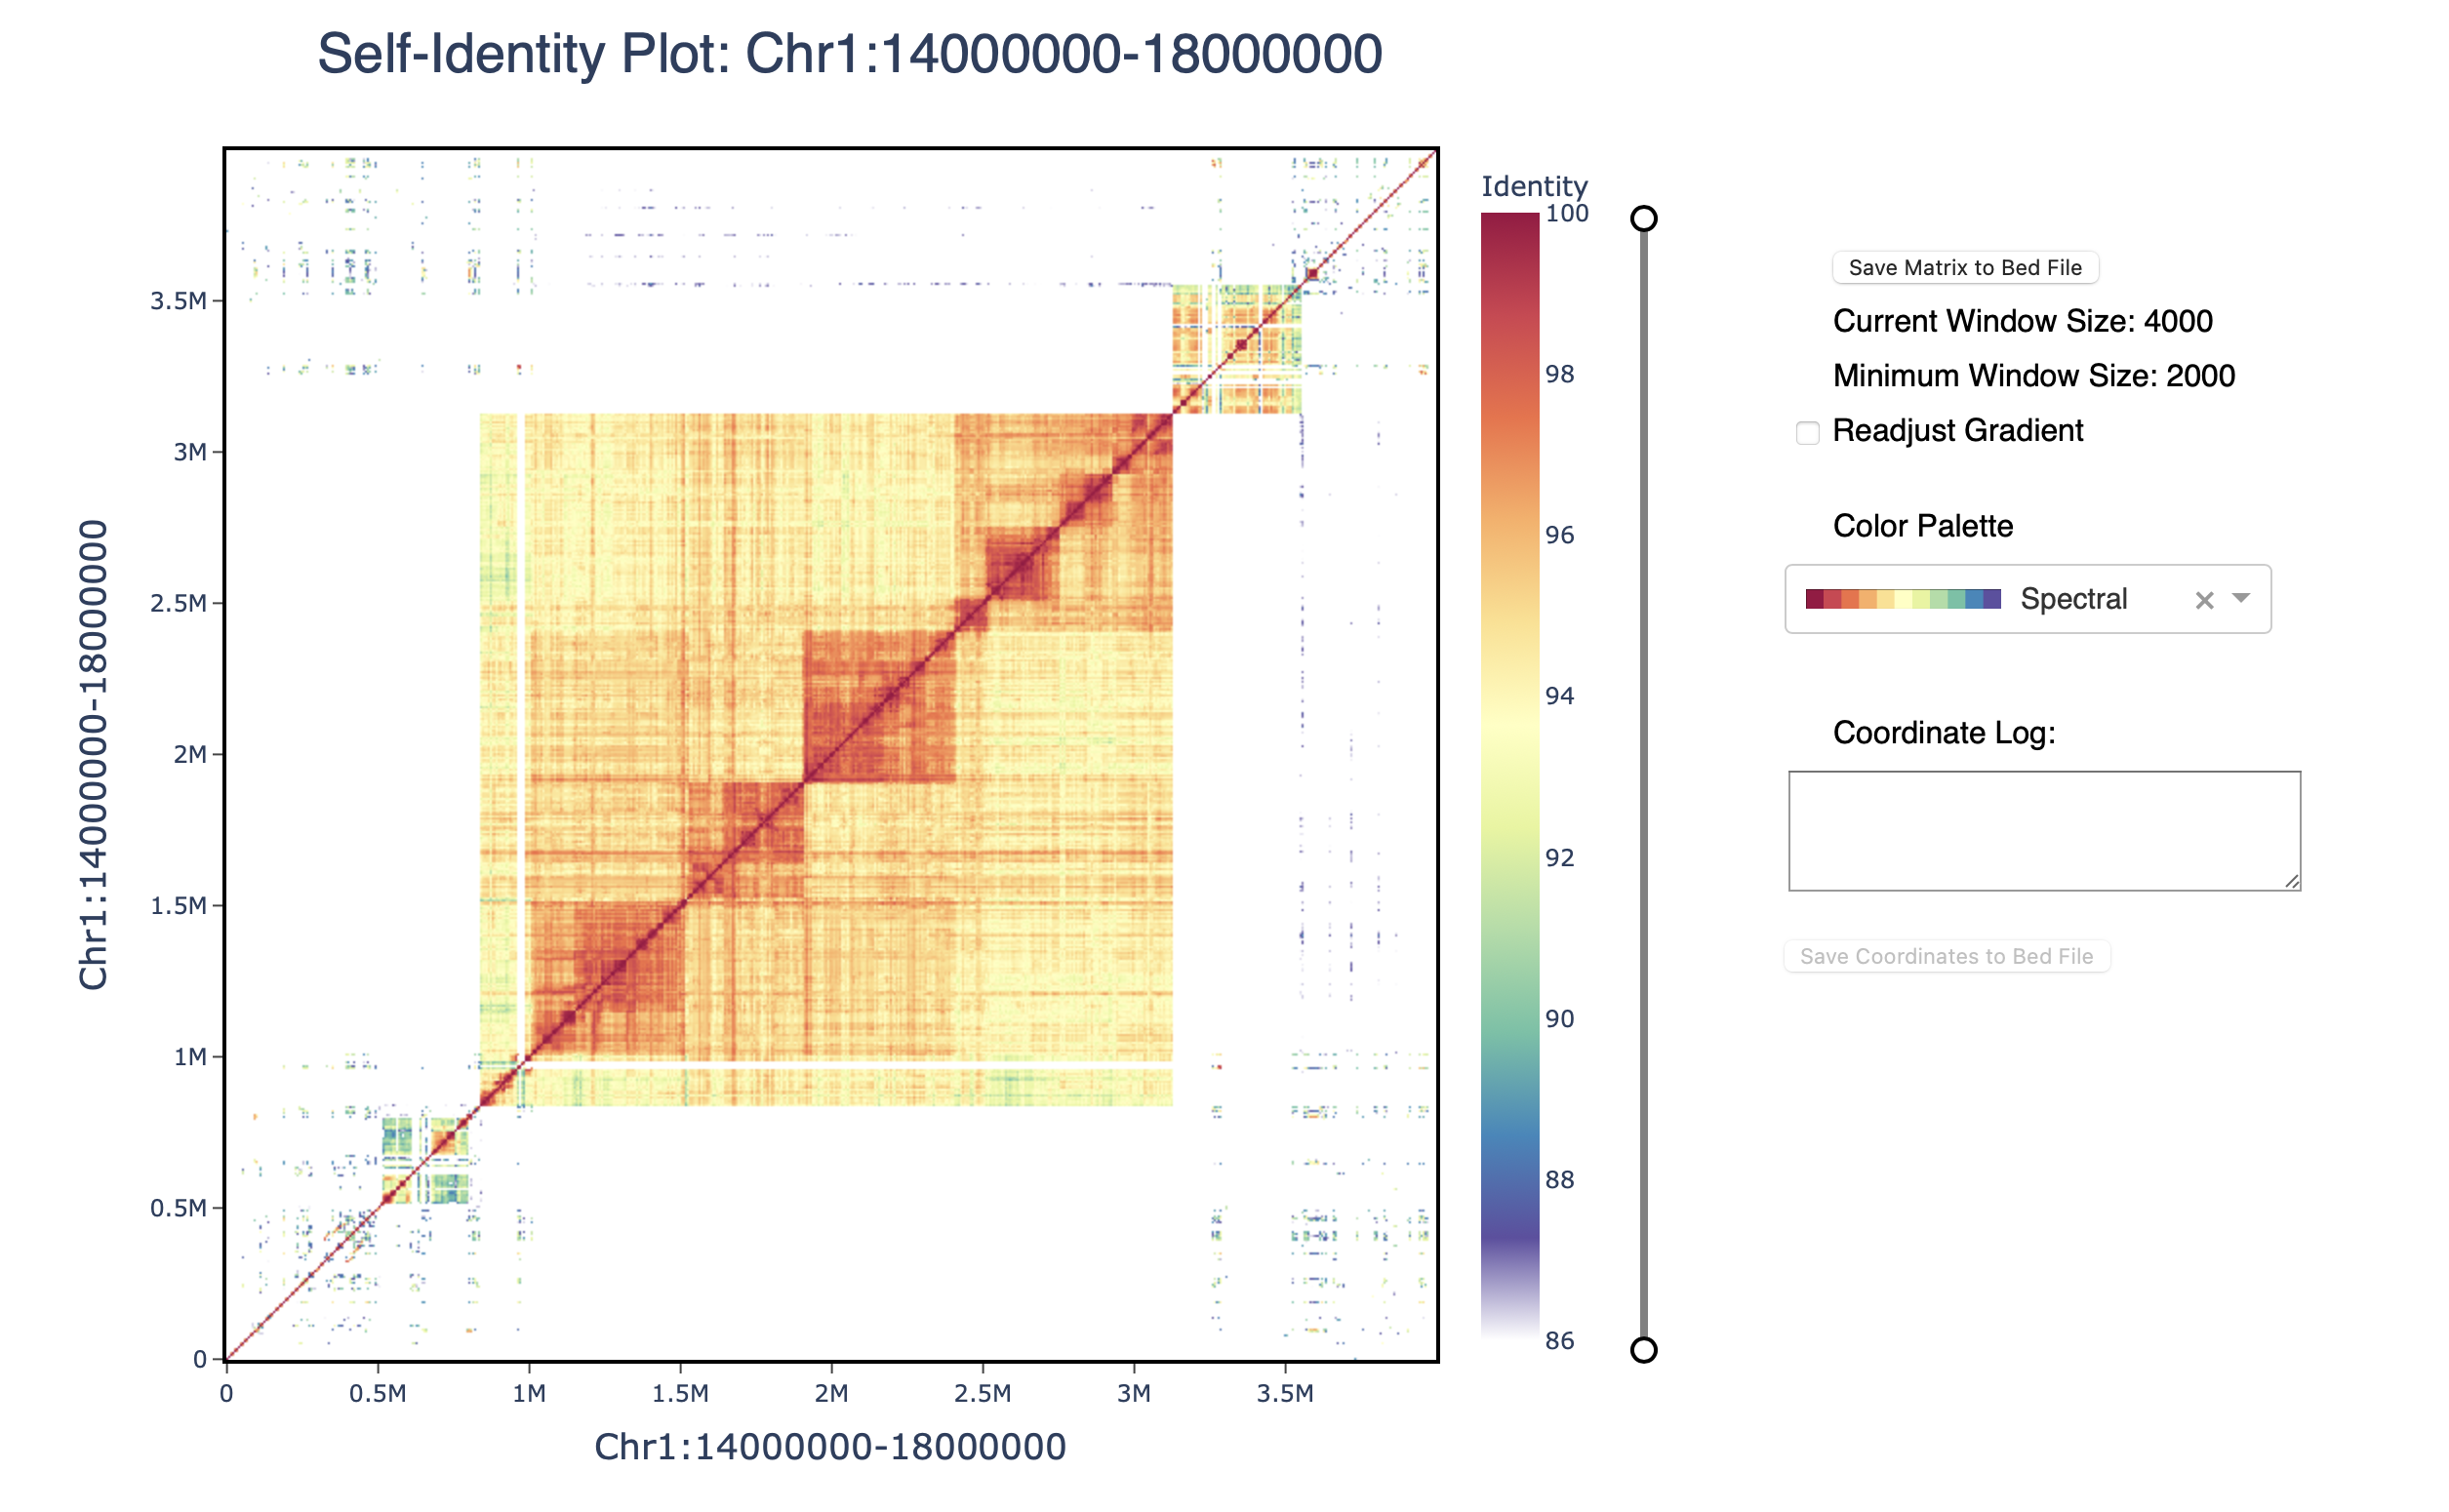
When running ModDotPlot to produce static plots, it is recommended to use a config file. The config file is provided in JSON, and accepts the same syntax as the command line arguments shown above. Here is an sample run using a centromeric sequence of Arabadopsis thaliana:
$ cat config/config.json

{
    "identity": 90,
    "palette": "Blues_7",
    "breakpoints": [
        90,
        91,
        92,
        93,
        96,
        98,
        99,
        100
    ],
    "output_dir": "Arabadopsis",
    "fasta": [
        "sequences/Arabadopsis_chr1_centromere.fa"
    ]
}
$ moddotplot static -c config/config.json
  __  __           _   _____        _     _____  _       _
 |  \/  |         | | |  __ \      | |   |  __ \| |     | |
 | \  / | ___   __| | | |  | | ___ | |_  | |__) | | ___ | |_
 | |\/| |/ _ \ / _` | | |  | |/ _ \| __| |  ___/| |/ _ \| __|
 | |  | | (_) | (_| | | |__| | (_) | |_  | |    | | (_) | |_
 |_|  |_|\___/ \__,_| |_____/ \___/ \__| |_|    |_|\___/ \__|

Running ModDotPlot in static mode

Retrieving k-mers from Chr1:14000001-18000000....

Progress: |████████████████████████████████████████| 100.0% Completed

Chr1:14000001-18000000 k-mers retrieved!

Computing self identity matrix for Chr1:14000001-18000000...

        Sequence length n: 4000000

        Window size w: 4000

        Modimizer sketch size: 1000

        Plot Resolution r: 1000

Progress: |████████████████████████████████████████| 100.0% Completed


Saved self-identity matrix as a paired-end bed file to Arabadopsis/Chr1:14000001-18000000/Chr1:14000001-18000000.bedpe

Triangle plots, full plots, and histogram for Arabadopsis/Chr1:14000001-18000000/Chr1:14000001-18000000 saved sucessfully.

Using samtools faidx will result in a genomic range being added to a fasta file’s header (eg. in the above sequence, the header is Chr1:14000001-18000000). ModDotPlot will parse this syntax to add the appropriate axis.
Adding custom bed file annotations
If providing a custom annotation file using --bed/b, ModDotPlot will output additional files:
- An annotation track
_ANNOTATION_TRACK, containing . Colors for ranges are set using the 9th column of the bedfile. - The annotation track overlayed with a self-identity dotplot
_ANNOTATEDfor each sequence present in the annotation track.
$ moddotplot static -f sequences/HG002_chr13_MATERNAL:1-4000000.fa -b config/hg002v1.1.cenSatv2.0.bed
  __  __           _   _____        _     _____  _       _
 |  \/  |         | | |  __ \      | |   |  __ \| |     | |
 | \  / | ___   __| | | |  | | ___ | |_  | |__) | | ___ | |_
 | |\/| |/ _ \ / _` | | |  | |/ _ \| __| |  ___/| |/ _ \| __|
 | |  | | (_) | (_| | | |__| | (_) | |_  | |    | | (_) | |_
 |_|  |_|\___/ \__,_| |_____/ \___/ \__| |_|    |_|\___/ \__|

Running ModDotPlot in static mode

...

Annotation track saved to chr13_MATERNAL:1-4000000/chr13_MATERNAL:1-4000000_ANNOTATION_TRACK

Triangle plots, full plots, and histogram for chr13_MATERNAL:1-4000000/chr13_MATERNAL:1-4000000 saved sucessfully.

Comparing two sequences

ModDotPlot can produce an a vs. b style dotplot for each pairwise combination of input sequences. Use the --compare command line argument to include these plots. When running --compare in interactive mode, a dropdown menu will appear, allowing the user to switch between self-identity and pairwise plots. Note that a maximum of two sequences are allowed in interactive mode. If you want to skip the creation of self-identity plots, you can use --compare-only:
moddotplot static -f sequences/*_MATERNAL*.fa --compare-only

Interactive Mode Commands
--port <int>
Port to display ModDotPlot on. Default is 8050, this can be changed to any accepted port.
-w / --window <int>
Minimum window size. By default, interactive mode sets a minimum window size based on the sequence length n/2000 (eg. a 3Mbp sequence will have a 1500bp window). The maximum window size will always be set to n/1000 (3000bp under the same example). This means that 2 matrices will be created.
-q / --quick <bool>
This will automatically run interactive mode with a minimum window size equal to the maximum window size (n/1000). This will result in a quick launch, however the resolution of the plot will not improve upon zooming in.
-s / --save <bool>
Save the matrices produced in interactive mode. By default, a folder called interactive_matrices will be saved in --output_dir, containing each matrix in compressed NumPy format, as well as metadata for each matrix in a pickle. Modifying the files in interactive_matrices will cause errors when attempting to load them in the future.
--no-plot <bool>
Save .bedpe to file, but skip rendering of plots. Must be used with --save.
-l / --load <directory>
Load previously saved matrices. Used instead of -f/--fasta.
Sample run - Interactive Mode
$ moddotplot interactive -f sequences/Chr1_cen.fa

  __  __           _   _____        _     _____  _       _
 |  \/  |         | | |  __ \      | |   |  __ \| |     | |
 | \  / | ___   __| | | |  | | ___ | |_  | |__) | | ___ | |_
 | |\/| |/ _ \ / _` | | |  | |/ _ \| __| |  ___/| |/ _ \| __|
 | |  | | (_) | (_| | | |__| | (_) | |_  | |    | | (_) | |_
 |_|  |_|\___/ \__,_| |_____/ \___/ \__| |_|    |_|\___/ \__|

Running ModDotPlot in interactive mode

Retrieving k-mers from Chr1:14000000-18000000....

Progress: |████████████████████████████████████████| 100.0% Completed

Chr1:14000000-18000000 k-mers retrieved!

Building self-identity matrices for Chr1:14000000-18000000, using a minimum window size of 2000....

Layer 1 using window length 2000

Progress: |████████████████████████████████████████| 100.0% Completed


Layer 2 using window length 4000

Progress: |████████████████████████████████████████| 100.0% Completed


ModDotPlot interactive mode is successfully running on http://127.0.0.1:8050/

Dash is running on http://127.0.0.1:8050/
The plotly plot can be navigated using the zoom (magnifying glass) and pan (hand) icons. The plot can be reset by double-clicking or selecting the home button. The identity threshold can be modified by seelcting the slider. Colors can be readjusted according to the same gradient based on the new identity levels.
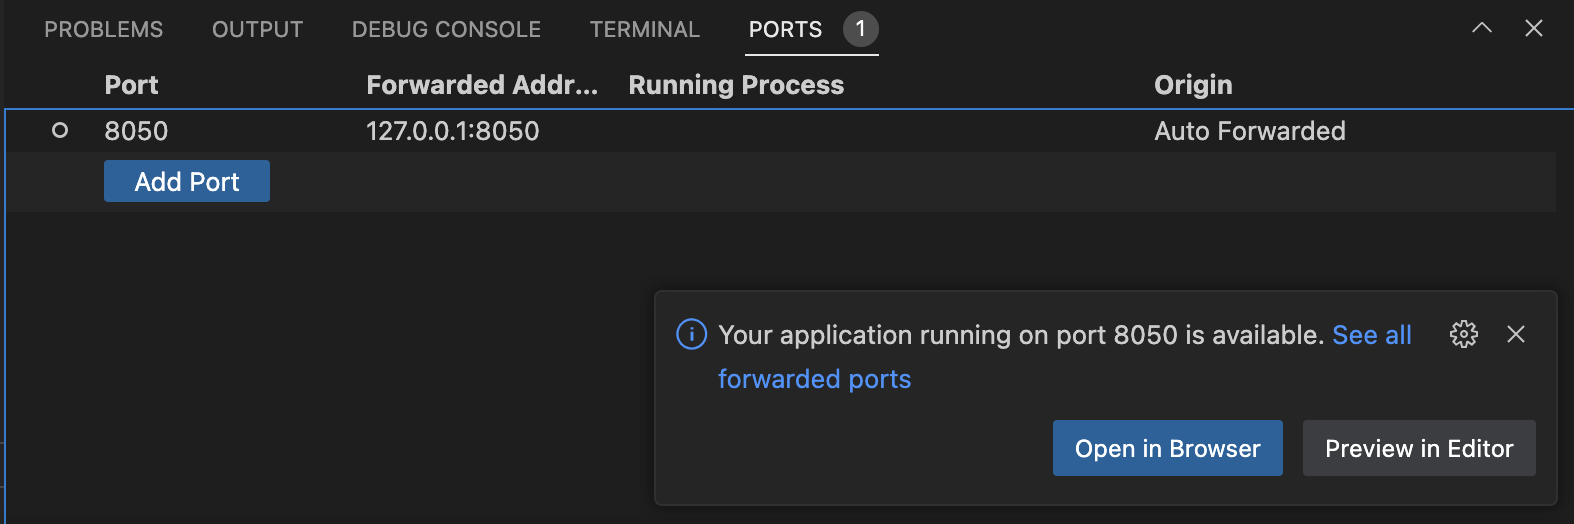
Sample run - Port Forwarding
Running interactive mode on an HPC environment can be accomplished through the use of port forwarding. On your remote server, run ModDotPlot as normal:
moddotplot interactive -f INPUT_FASTA_FILE(S) --port HPC_PORT_NUMBER
Then on your local machine, set up a port forwarding tunnel:
ssh -N -f -L <LOCAL_PORT_NUMBER>:127.0.0.1:<HPC_PORT_NUMBER> HPC@LOGIN.CREDENTIALS
You should now be able to view interactive mode using http://127.0.0.1:<LOCAL_PORT_NUMBER>. Note that your own HPC environment may have specific instructions and/or restrictions for setting up port forwarding.
VSCode now has automatic port forwarding built into the terminal menu. See VSCode documentation for further details
Questions
For bug reports or general usage questions, please raise a GitHub issue, or email alex ~dot~ sweeten ~at~ nih ~dot~ gov
Known Issues
-
Mac users might encounter the following unexpected command line output:
/bin/sh: lscpu: command not found. This is a known issue with Plotnine, the Python plotting library used by ModDotPlot. This can be safely ignored. -
If you encounter an error with the following traceback:
rv = reductor(4) TypeError: cannot pickle 'generator' object, ths means that you have a newer version of Plotnine that is incompatible with ModDotPlot. Please uninstall plotnine and reinstall version 0.12.4pip install plotnine==0.12.4. -
The error ` UserWarning: h5py is running against HDF5 1.xx.x when it was built against 1.xx.x, this may cause problems
is due to the h5py library used by cooler having conflicting versions in the dependency tree. This can also be safely ignored, but if you want to remove this message runpip uninstall -y h5py