MetagenomeScope
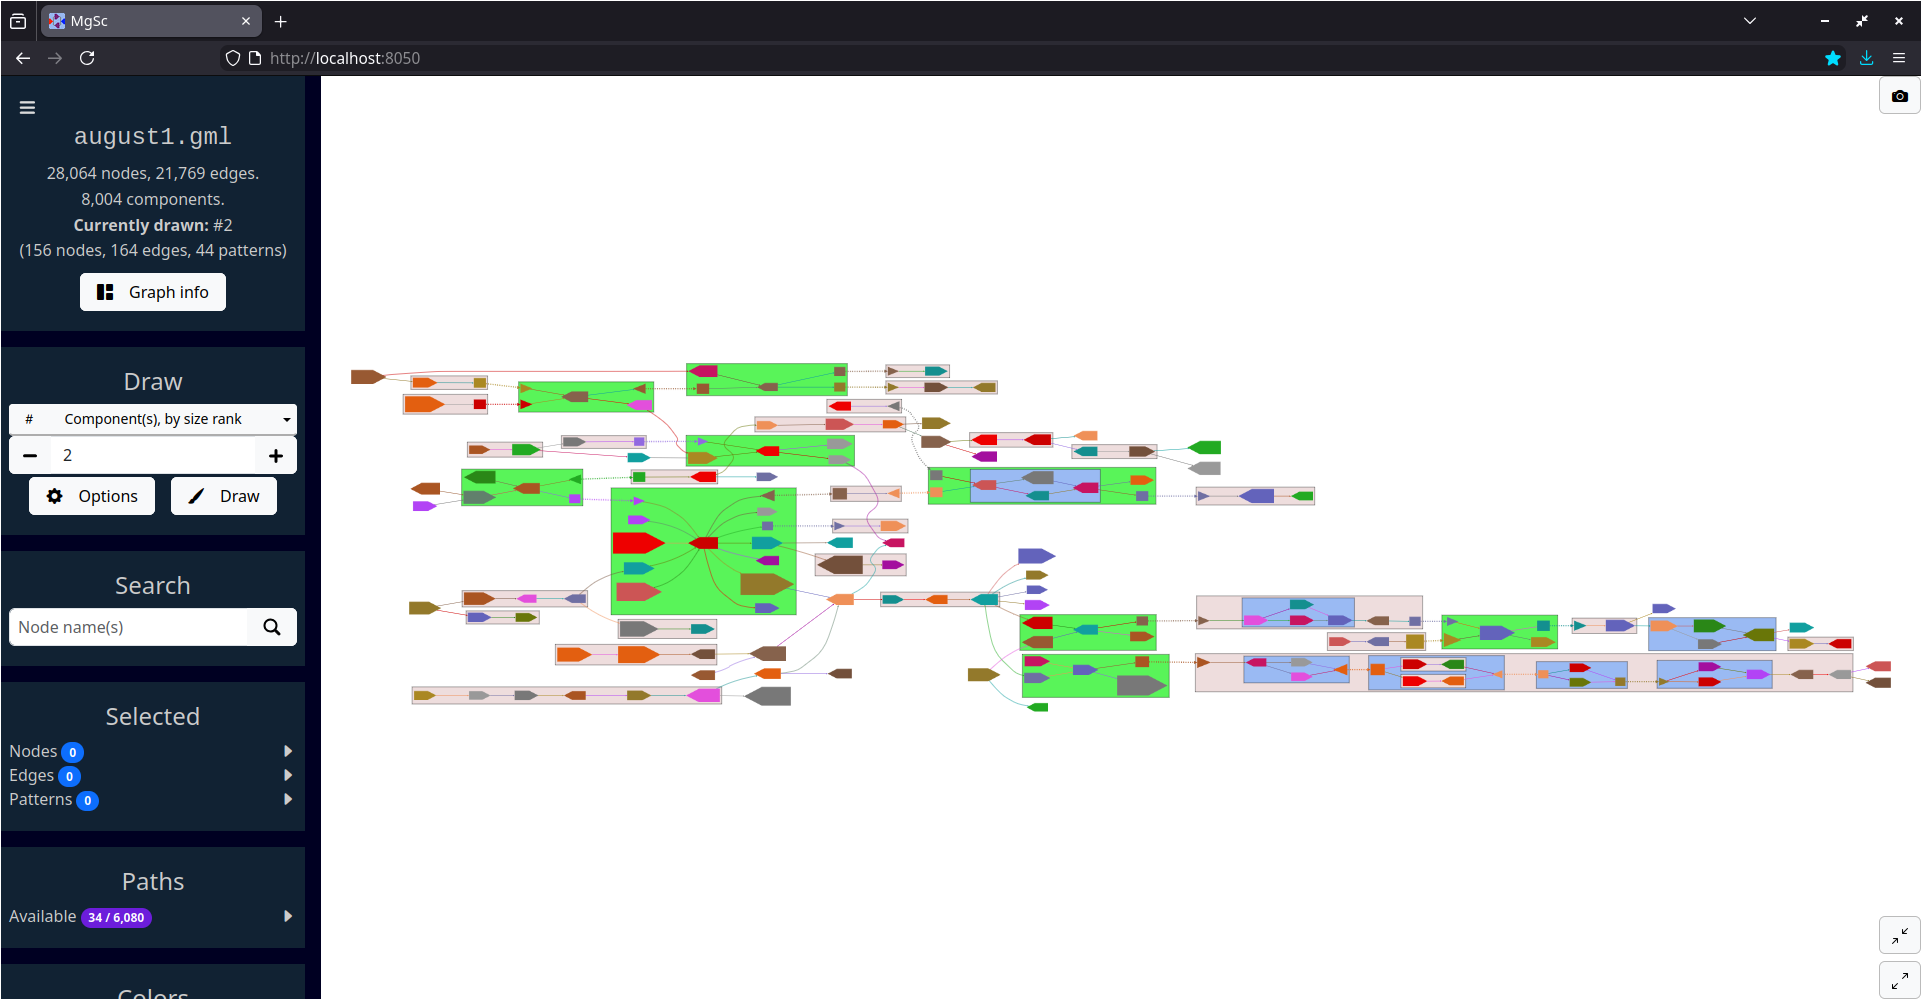
Second-largest connected component of a metagenome scaffold graph produced by MetaCarvel (Ghurye et al., 2019).
News
February 2026: After ten years and three thousand commits (!), we've released version 1.0.0 of MetagenomeScope!
January 2026: We've been working on revamping and extending the tool recently; the new version is coming along well. Please see the GitHub page for details.
December 2020: We just merged in a new version of the codebase featuring many new features, including hierarchical pattern decomposition, bubble boundary duplication, drawing multiple components at once, and much more. Check out the code and installation instructions on GitHub!
August 2018: Gave a presentation and tutorial on MetagenomeScope during the 2018 Strategies and Techniques for Analyzing Microbial Population Structures (STAMPS) course at the Marine Biological Laboratory! Check out the slides here, and check out the command-line MetagenomeScope tutorial here.
January 2018: Presented a poster on MetagenomeScope at the 2018 Winter Mid-Atlantic Microbiome Meetup (M3)!
September 2017: Presented a poster on MetagenomeScope at GD 2017! Check it out here.
Overview
MetagenomeScope is a visualization tool designed for sequence assembly graphs. MetagenomeScope aims to display a semi-linearized, hierarchical overview of the input graph while emphasizing the presence of certain structural patterns in the graph.
Code
The source code for MetagenomeScope is publicly available on GitHub here. MetagenomeScope is licensed under the GNU General Public License, version 3. (If you're interested, the source code for this site is also available on GitHub.)
Contact
MetagenomeScope was created by members of the Pop Lab in the Center for Bioinformatics and Computational Biology at the University of Maryland, College Park.
Please open a GitHub issue if you have any questions or suggestions.